

GPU profiling
A GPU profile answers one question first: what holds this endpoint’s GPUs back?infercrane profile
records a bounded trace through the serving engine’s own profiler, analyzes it, and leads with a
one-sentence verdict that cites the measured values. The numbers behind it, a timeline, a flame
graph, and a before-and-after comparison sit underneath, and the diagnosis feeds
Optimize so a fix can be tested on your
traffic.
infercrane profile coder, abridged (sample trace: generated, not a measurement)
Capture a profile
The engine writes its trace to its own disk, so run the command where both the engine’s HTTP port and its trace directory are reachable: on the GPU host, or in a sidecar container that mounts the same trace volume.
The command detects the engine (SGLang answers
/get_server_info, vLLM /version), asks before it
starts, calls /start_profile, waits for --duration (2 to 30 seconds), calls /stop_profile,
waits up to --flush-timeout for the engine to finish writing, analyzes the trace locally, and records
the result against the deployment’s active revision. --deployment names the deployment when it is
not called like the endpoint. --engine-key-env NAME sends a bearer key from that environment
variable when the engine requires one.
What a capture costs
While it records, the engine traces every kernel launch with the PyTorch profiler (Kineto on CUPTI or ROCm), so that replica serves more slowly for the duration. InferCrane does not measure the slowdown and makes no claim about its size. The command states this and asks before starting; pass--yes in
scripts. A capture is bounded to 30 seconds, and the profiler is stopped even when the command is
interrupted. Capture on one replica, at a time when slower requests for a few seconds are acceptable.
What is recorded
A capture never contains request content. The parser reads only kernel, operator, and runtime-call names with their times, devices, streams, and correlation IDs, plus the input shapes of matrix multiplies. Python stack frames, operator arguments such as concrete inputs, and everyrecord_function annotation other than the engine-step markers are skipped while the file is read.
The full trace stays where the engine wrote it; InferCrane stores the analysis, the flame-graph stacks,
and an excerpt of the busiest second (at most 20,000 events).
Hardware counters during the capture
--dcgm-url http://127.0.0.1:9400/metrics samples DCGM Exporter once a second
while the trace records and keeps SM active, SM occupancy, tensor active, DRAM active, PCIe, and
NVLink throughput beside the analysis. A field the exporter does not send stays unknown. These are
NVIDIA DCGM fields: AMD Instinct GPUs report no equivalent that InferCrane maps yet, so their hardware
counters stay unknown.
Analyze traces you already have
Columns are read by name, so added columns in newer tool versions are ignored.
--no-upload analyzes
without signing in or recording anything. --accelerator NAME names the GPU when the trace does not,
and --peak-tflops with --peak-tbps set the roofline peaks for a GPU that has no listed datasheet
peak.
What the analysis reports
The analysis isgpu-trace-analysis-v1. Its definitions follow
Holistic Trace Analysis (MIT),
re-implemented in Go so the CLI needs no Python. The window runs from the first to the last GPU
activity. Every share is a fraction of GPU time (window × GPUs) unless it says otherwise. A value the
trace cannot support is null and its section’s reason says why; it is never shown as zero.
Verdict rules
The first rule that fires names the bottleneck; every fired rule is listed as a finding with its measured value and threshold.
With no rule naming a bottleneck, a GPU busy at least 80% of the time reads as
busy; otherwise the
verdict is unknown, and says so when the trace has no launch calls to explain idle time.
When Optimize plans from the endpoint’s diagnosis, the newest capture of the active revision from
the last 7 days carries these findings, with their measured values and thresholds, into the plan.
Host-launch, exposed-communication, roofline, and attention findings can choose a setup to measure;
gpu.idle, gpu.long_bubbles, and gpu.decode_dominant choose nothing on their own. See
rules from a GPU trace.
Roofline peaks
Peaks are vendor datasheet figures (dense, without sparsity), not measurements: H100 SXM and PCIe, H100 NVL, H200 and H200 NVL, A100 40GB and 80GB, L40S, L4, A10, GeForce RTX 4090, and AMD Instinct MI300X and MI325X. Any other accelerator leaves the roofline unknown until--peak-tflops and
--peak-tbps declare one.
Read and compare captures
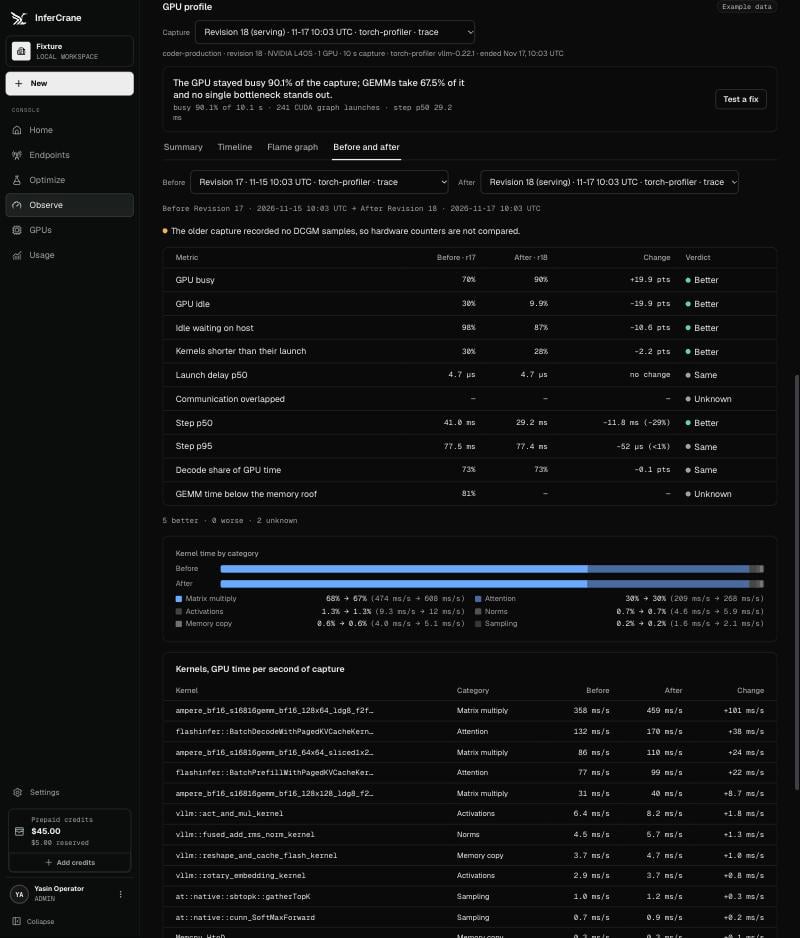
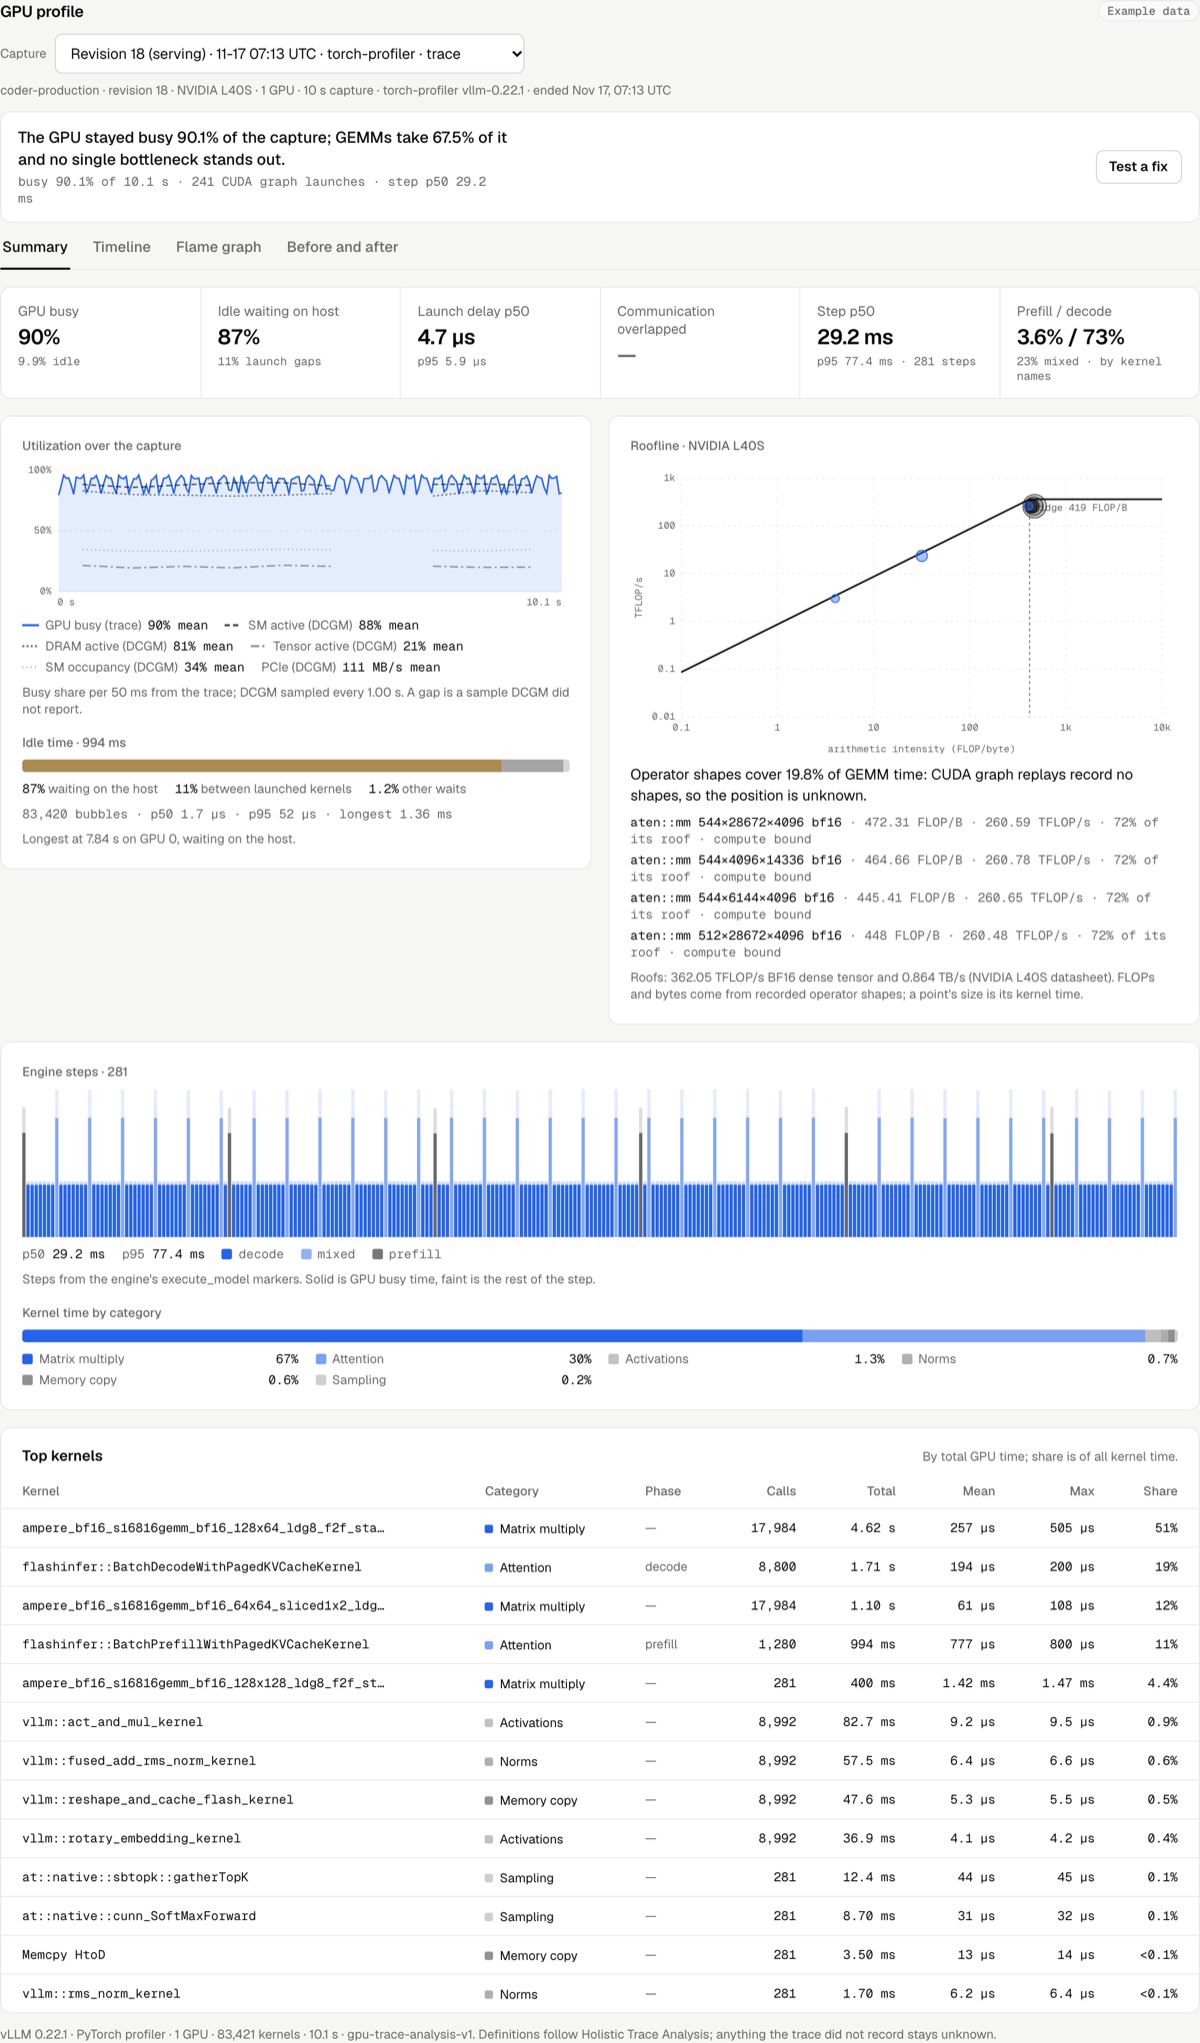
--open opens the capture in the dashboard: Observe › Profiling leads with the verdict, and with
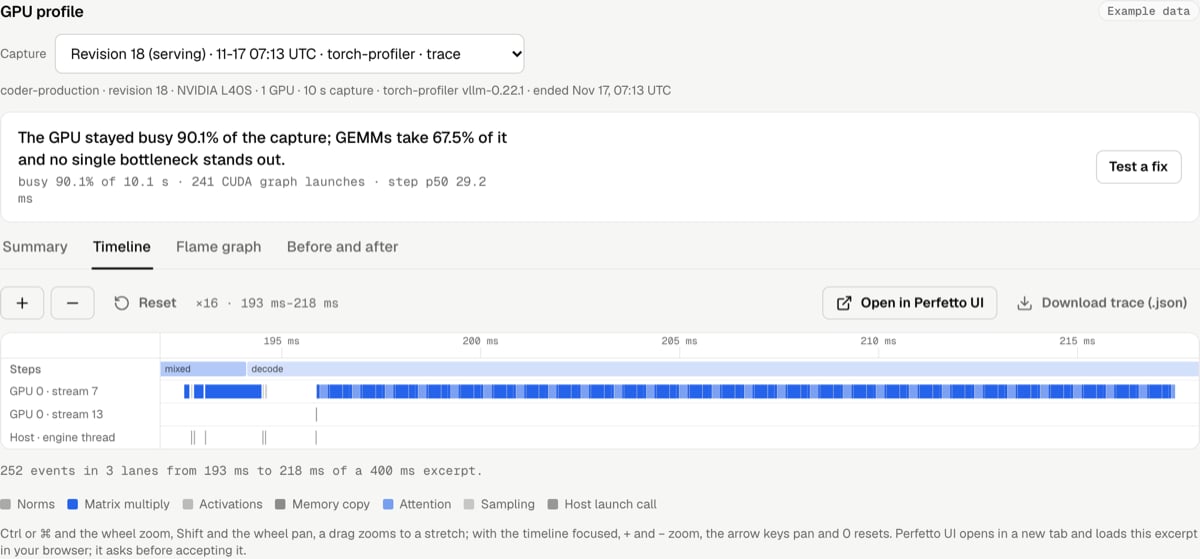
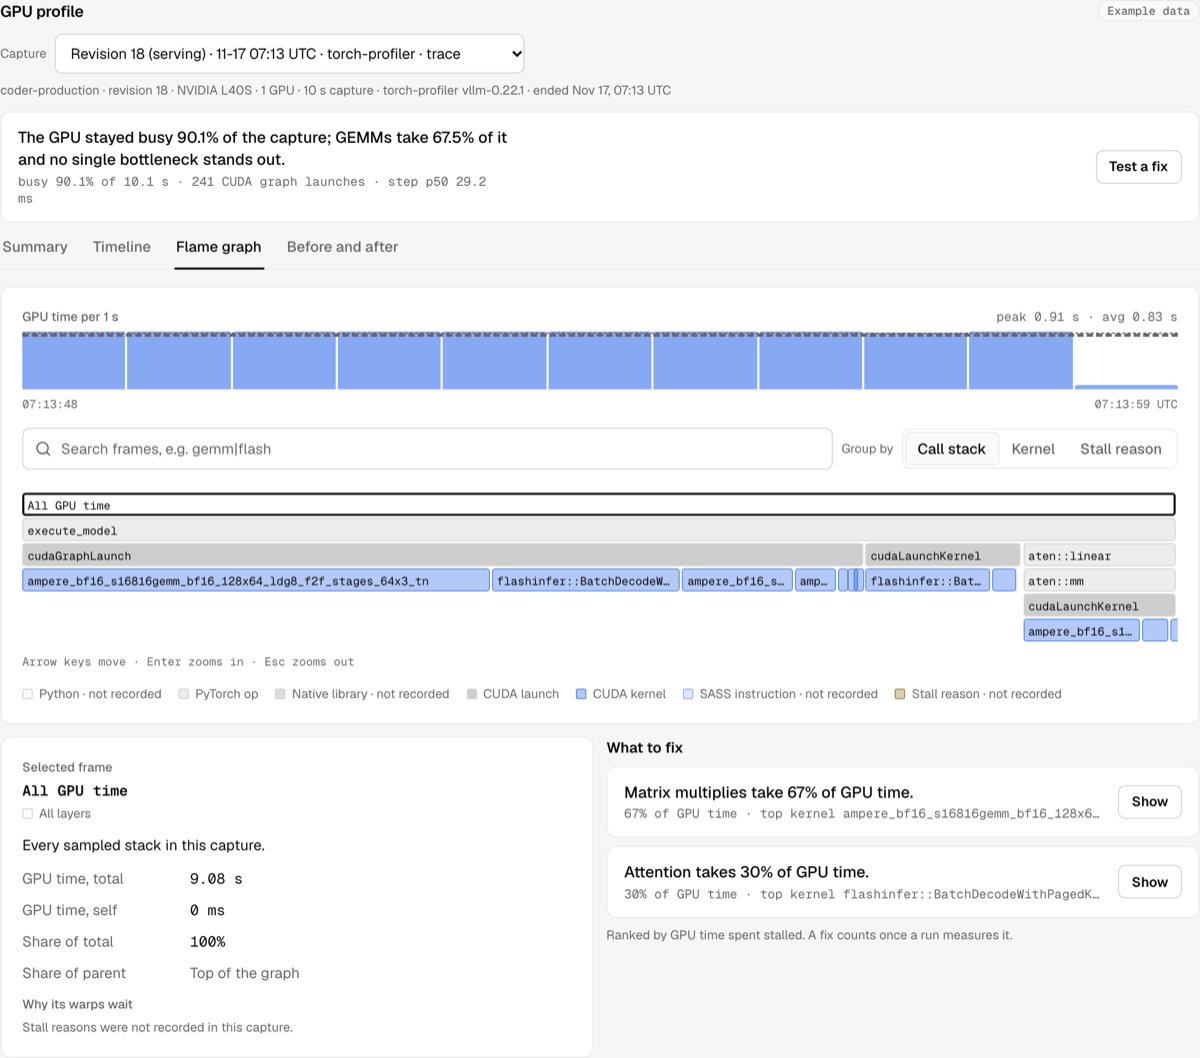
Advanced on it shows the utilization and roofline charts, the top kernels, a zoomable timeline of
the busiest second with an Open in Perfetto UI button, the flame graph, and the comparison. The
trace files are standard Kineto JSON, so they also open directly in Perfetto UI.
The screenshots below show the dashboard’s example data, not a measurement.

JSON output
--output json is stable. A capture, trace analysis, or stored read prints
infercrane.profile-result/v1:
--list prints infercrane.profile-list/v1 and --compare prints infercrane.profile-comparison/v1
with the API’s comparison fields.
API
A v2 recording is a v1 recording plus
analysis (required) and
timeline_excerpt (optional). The control plane validates every bound and range: shares in 0..1,
busy plus idle equal to the window, unknown values with a reason, at most 25 top kernels, 1,000 steps,
50 roofline points, and 20,000 excerpt events within 2 seconds, and an analysis window that fits the
capture. It cannot re-run the analysis, so a recording, like a DCGM snapshot, is trusted to the
deploy permission of whoever posts it.
Storage and retention
The recording is one JSONB document ingpu_profiles beside its capture’s tenant, deployment, revision,
tool, and times. The newest eight captures per deployment are kept, and captures that ended more than
30 days ago are removed when the next one is recorded and are never read. Nothing is read on the
inference path.
Continuous signals
Profiling traces are short and opt-in. For always-on, low-overhead counters, runinfercrane telemetry collect dcgm DEPLOYMENT --url … --interval 15s beside
dcgm-exporter: it posts SM active, SM occupancy, tensor
active, DRAM active, PCIe, and NVLink readings every interval, each fresh for three intervals, and the
readiness rules read them continuously. On AMD Instinct GPUs, infercrane telemetry collect amd reads
the AMD Device Metrics Exporter the same way, but only utilization, power, temperature, and device
count; see AMD Instinct GPUs.
Continuous kernel-level profiling with eBPF and CUPTI
(Parca Agent with parcagpu,
Apache-2.0) was evaluated and is not integrated: it needs a privileged eBPF DaemonSet on every node and
CUDA_INJECTION64_PATH in the serving container, which fits operator-owned Kubernetes but not RunPod,
Vast, or serverless replicas. Its pprof output could become a v1 recording later. Commercial continuous
profilers such as Zymtrace stay an integration option rather than something InferCrane rebuilds.
Licences of every tool involved are on Dependencies.
Sample traces
internal/gputrace/testdata holds small traces generated by internal/testtools/tracefixture in the
shapes vLLM and SGLang (Kineto), rocprofv3, and Nsight Systems write, with golden analyses. They are
generated samples: kernel names follow the upstream libraries, every time is made up, and none of their
numbers is a measurement. Regenerate them with
go test ./internal/gputrace -run TestSample -update.